Interactive data viewers
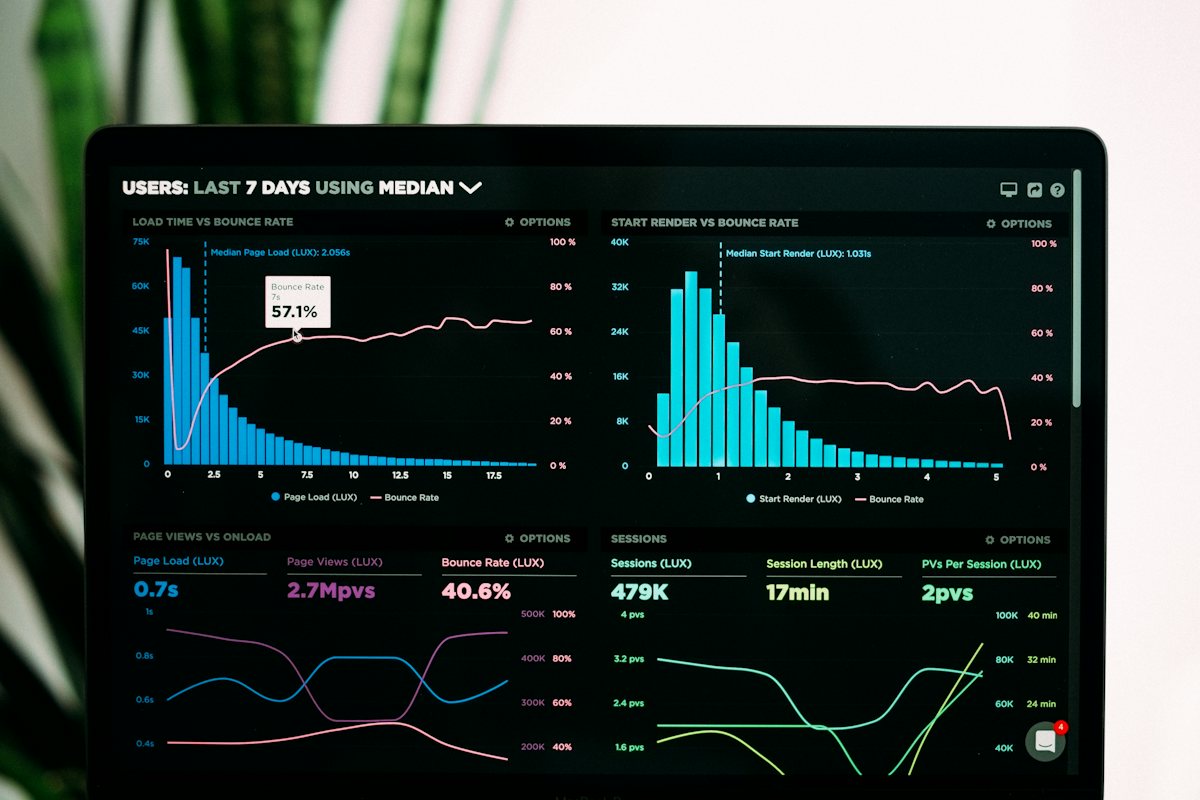
Dashboards for exploring the project's results with filters, comparisons and change over time.
custom tools
Some results don't fit in a text or a video: they need an audience that can explore them. We build custom tools to read and visualise your project's data.
We've worked with

















the challenge
A project's data usually stays in spreadsheets, reports or repositories that only the people who produced it understand. To everyone else, those results are invisible.
our role
We have our own development team, the same one that built the Tuinbit platform. We design with you how your data should be read, and build the tool that makes it possible, built into the project website.
the service
Dashboards for exploring the project's results with filters, comparisons and change over time.
For data with a geographic dimension: where it's measured, where it happens, where it changes.
Graphics designed to tell one specific result, on the website, on social media, or in a report.
Search tools and record pages for browsing the project's records, archives or collections.
A space to publish and download the data the project decides to open up, well documented and easy to reuse.
in detail
TODO-EJEMPLO: a data viewer mockup using one of the home page's fictional projects (MAREA: a map of sampling points with a chart beside it that changes when a point is selected), with invented data marked as an example.
the process
And who's going to use it: the research community, managers, media or the general public.
What's shown first, what gets compared, and what gets explained.
Before anything gets built.
And integrate it into the project website.
And update it with new data for the life of the project.
All our tools are accessible, fast, mobile-friendly and built for people who don't know the data.
frequently asked questions
Don't see yours? Email us at info@tuinbit.com and we'll answer you ourselves.
We start from whatever formats you already use. We go through how it's organised with you and, if needed, prepare it for the tool.
TODO-COPY
more solutions
We record an episode a month with the people on your team and edit it in full: video, audio, subtitles and chapters. Everything else comes from that.
Learn more →
We build and maintain the website where your research lives, with the article for every episode and the materials you publish along the way.
Learn more →
We design your project's communication strategy, from the proposal to the final report, and make sure every piece reaches the people who need it.
Learn more →
A research project is also a brand: a name, a voice and a way of looking. We define it and carry it through every piece.
Learn more →
What happens at a conference gets told once, and then it's gone. We record it and turn it into material that keeps working afterwards.
Learn more →
what happens next